I led the design and research for a suite of geospatial tools for the US Forest Service to improve the management of national system trails.
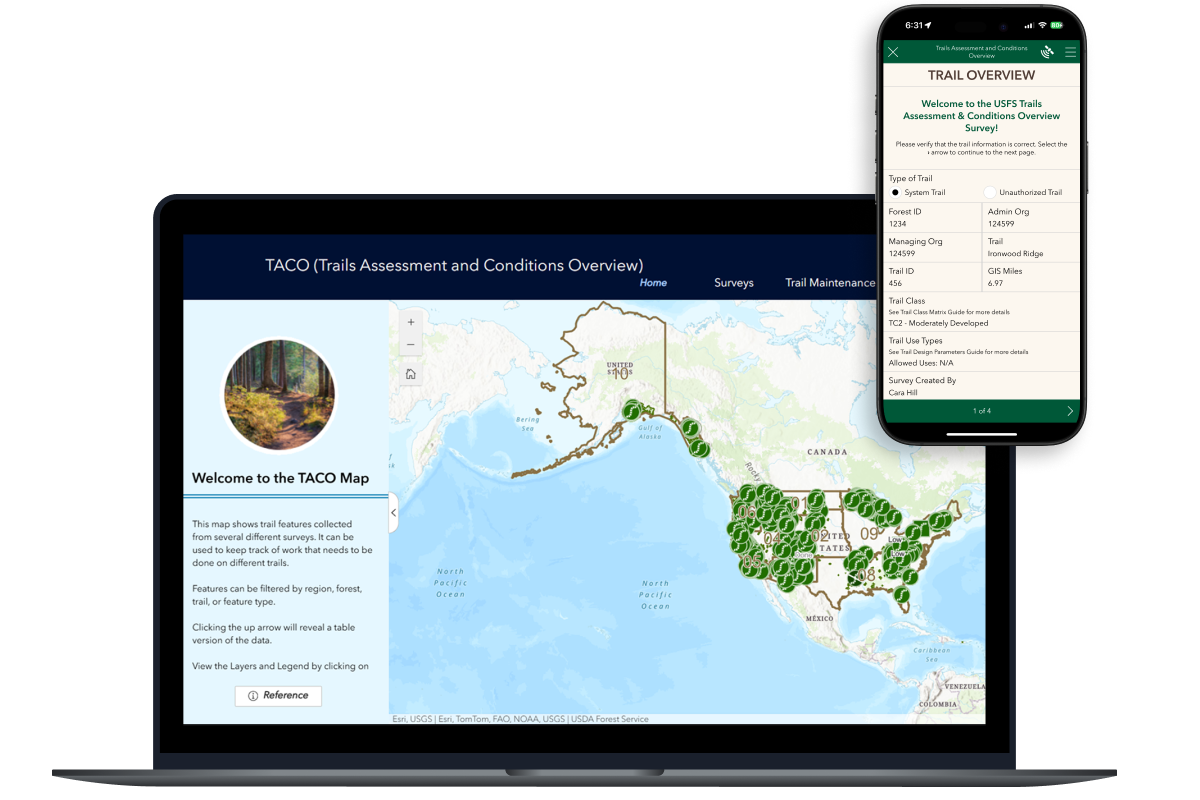
Built on ESRI's suite of geospatial tools, the solution included a mobile app for field data collection, a web app for managers, and a backend data-loading mechanism that synchronized collected data with the national system of record. The mobile app supported three tailored surveys: for agency staff, partner organizations, and the general public.
Methodologies
User Research
Workshop Facilitation
Prototyping
Usability Testing
Timeline
9 months to MVP release
Tools
Adobe XD
Survey123
ArcGIS Online
Javascript
Overview
Problem
Outdated, manual trail data collection processes limited the Forest Service’s ability to efficiently manage 160K+ miles of trails and consistently communicate maintenance needs across regions.
Goal
Connect field data collection and regional management through a modern geospatial platform that improves efficiency, accuracy, and consistency across trail systems.
Research
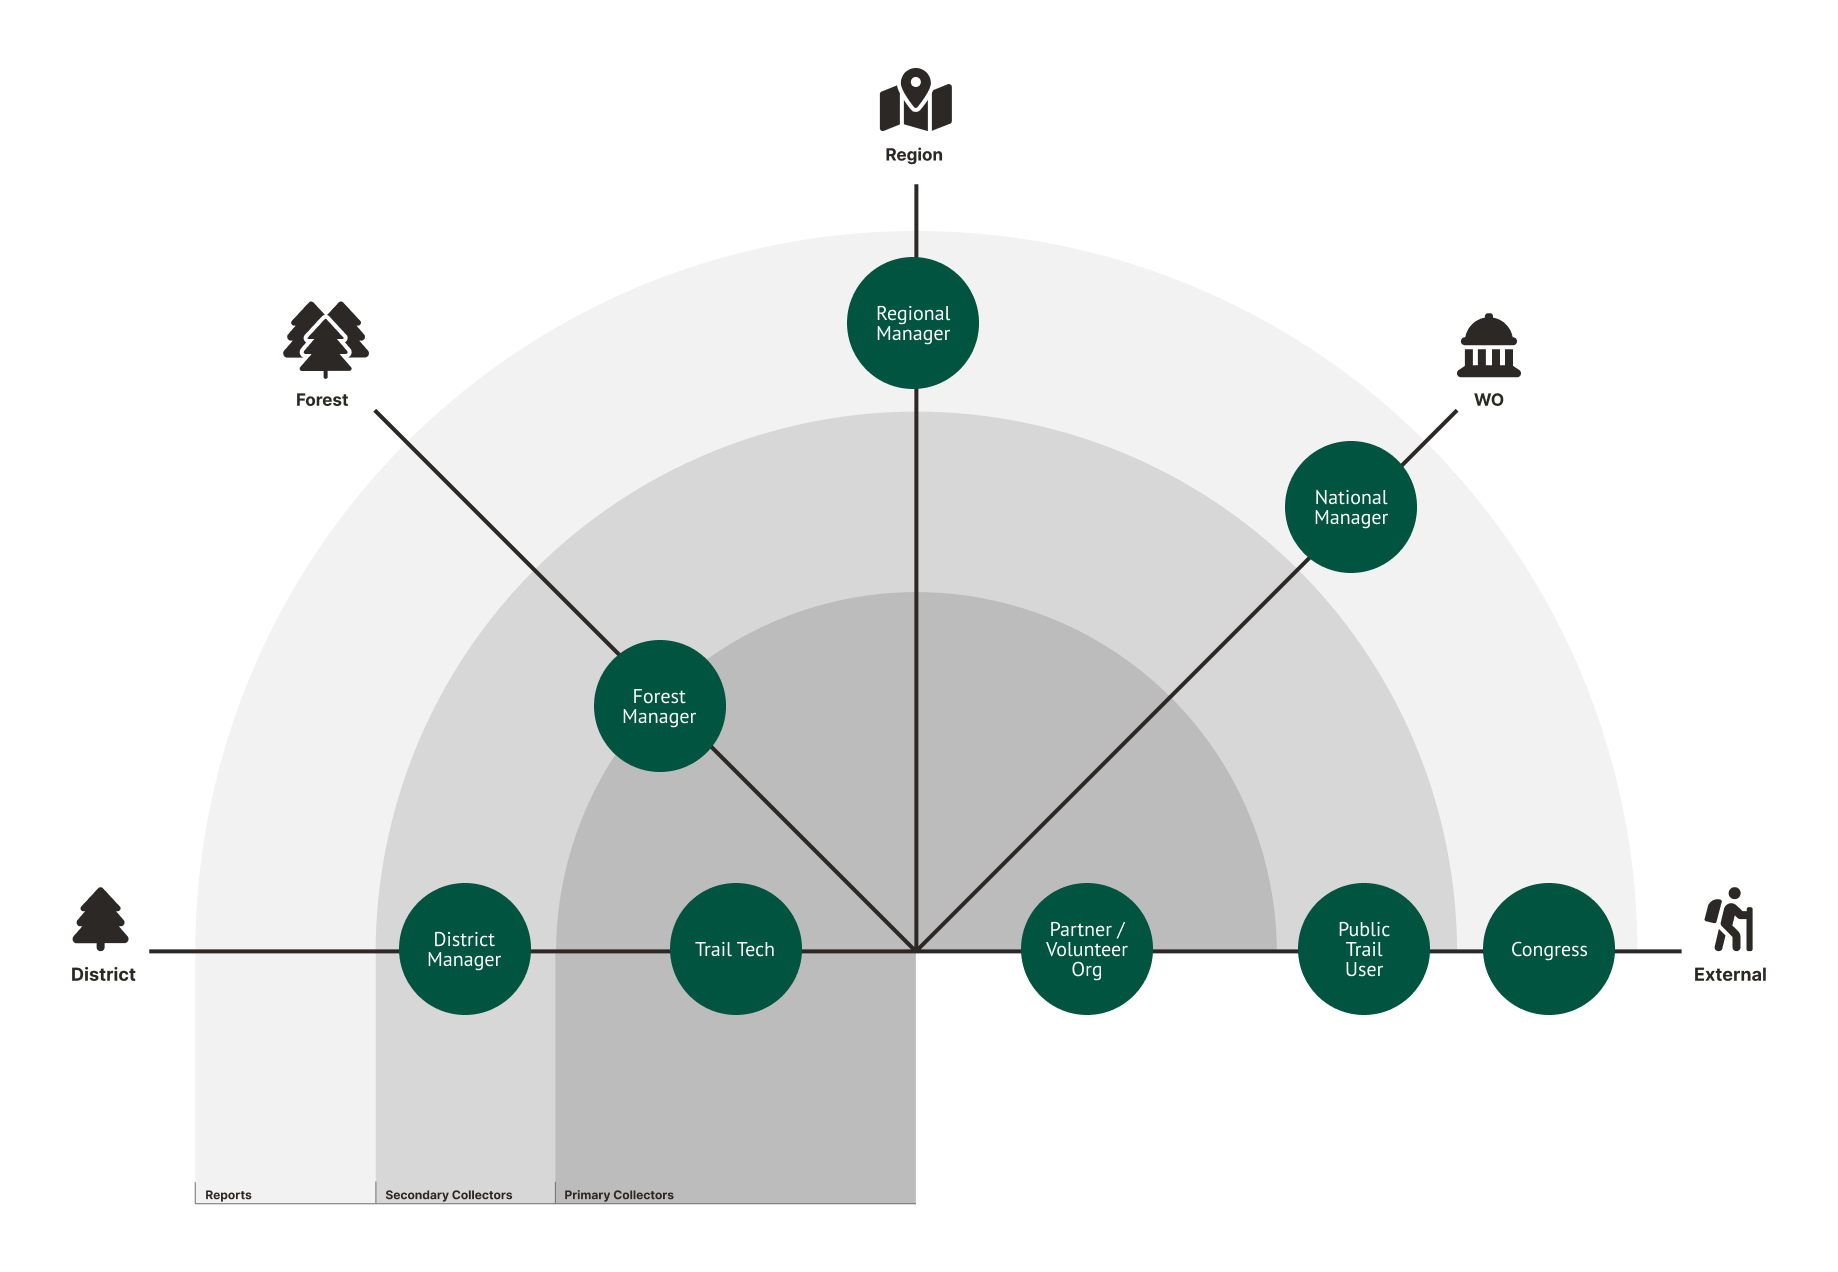
Mapping the Ecosystem
A layered network of internal and external users required ecosystem mapping to clarify how trail data flows between field staff, leadership, and partners.
User Interviews
Through remote interviews with 24 users, I gained a detailed picture of workflows, constraints, and priorities from crew members to leadership. Other key insights were:
Data flowed upward, but rarely downward
Field staff rarely saw how their data influenced planning or funding, recducing motivation to capture accurate info.

No unified process across regions
Data collection workflows differed across regions, forests, and districts. This fragmentation eroded trust in the data.

Overly complex systems discouraged use
Crews found the existing interfaces too bloated and cumbersome, often bypassing data entry entirely.

Need for lightweight, flexible tools
Crews consistently asked for mobile, offline-capable tools that fit seamlessly into their fieldwork, rather than complex systems requiring extra effort.
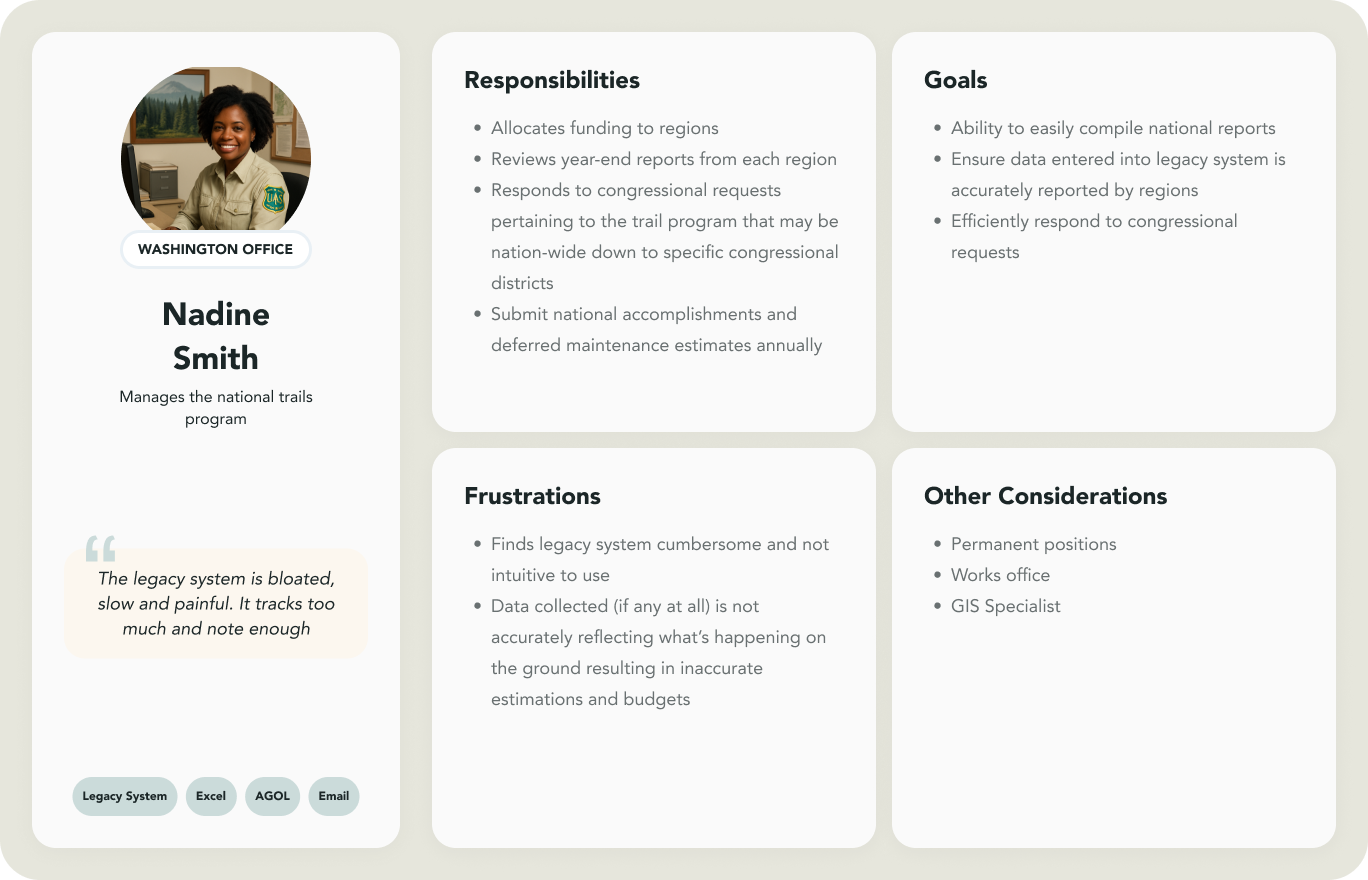
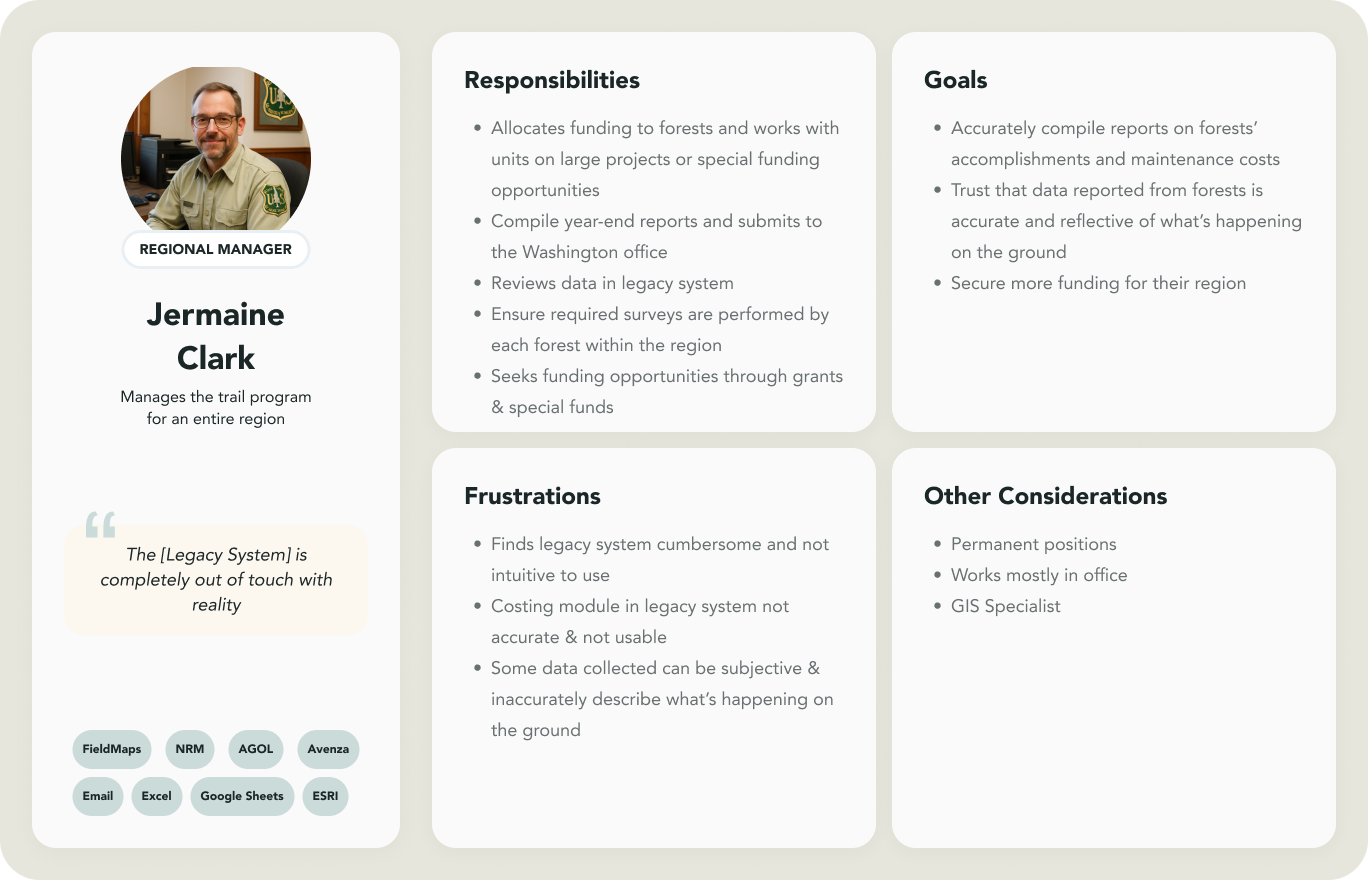
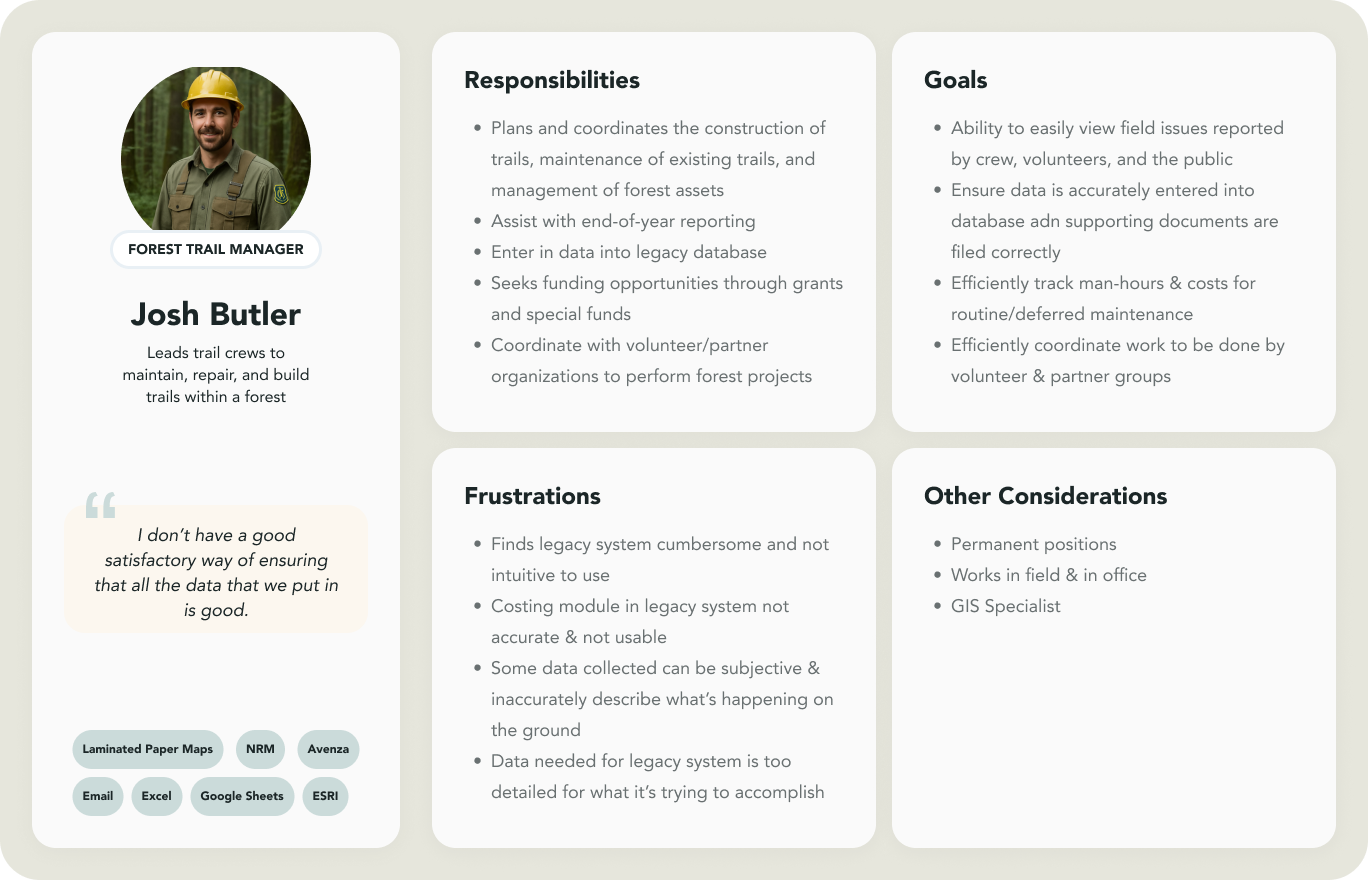
Personas

Feature Prioritization & Roadmap Planning

DESIGN
How might we transform trail management into a seamless, data-driven process that empowers crews and informs leadership?
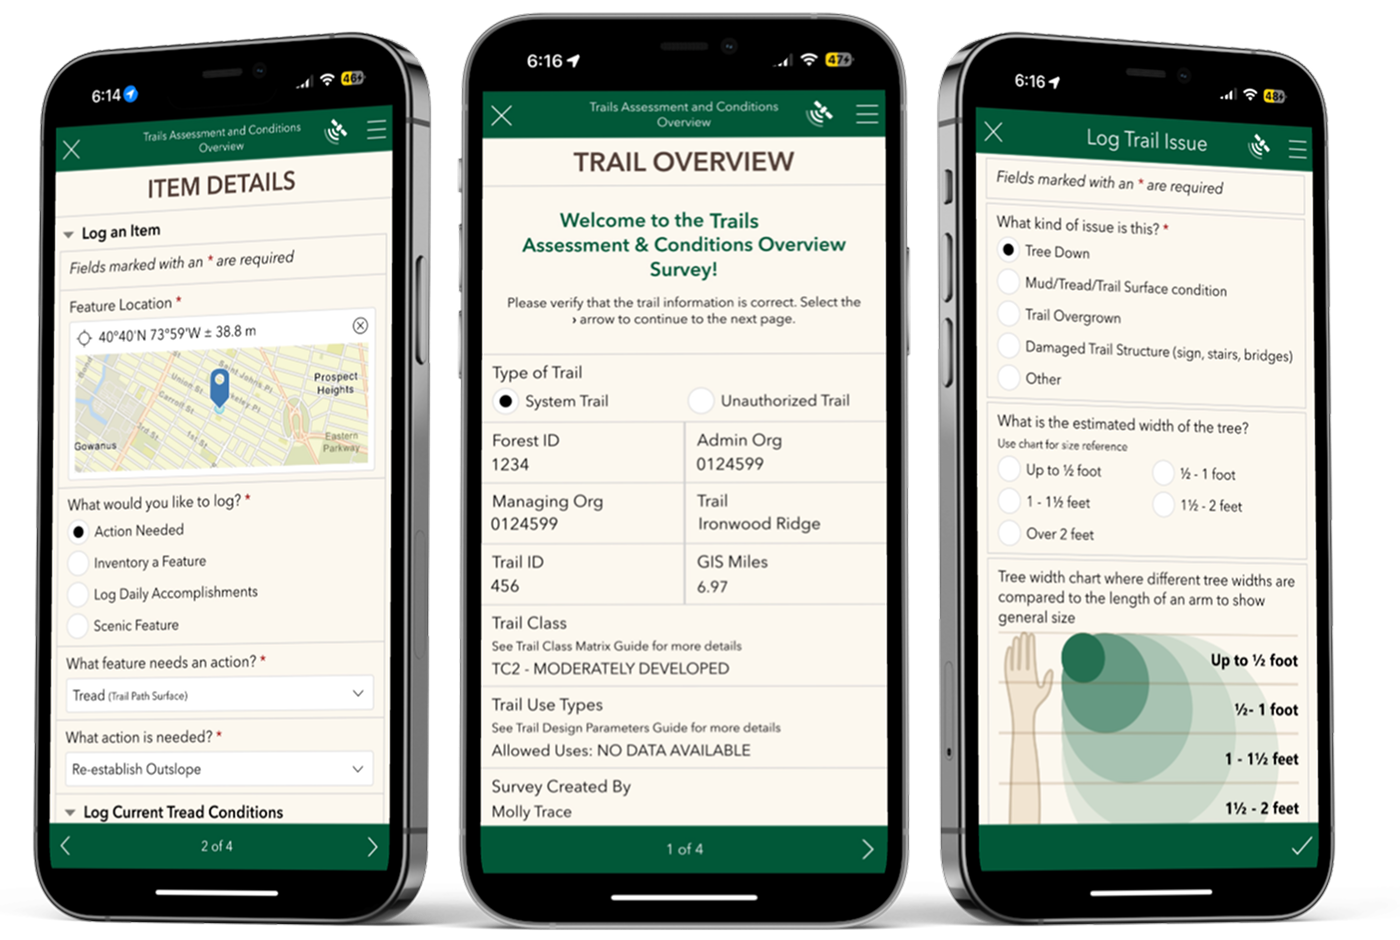
To address this question, we built two streamlined Survey123 prototypes to find the best fit for users' mental models: one organized by trail feature type, the other by action needed.
We also made key design decisions to support use in challenging field conditions:
- The ability to mark the user's location with a pin during logging
- Pre-populating trail data to reduce cognitive load & redundant entry
- Minimal text input to allow for quick logging in poor weather
- Offline capability for use in remote backcountry areas
ITERATE
I conducted A/B testing with six users to determine which organizational method best aligned with their mental models.
User feedback showed a preference for the action-oriented prototype, aligning with actual work processes. We identified several additional user needs that were crucial for improving the tool's effectiveness:
- Enhanced high-contrast interface for better visibility in bright sunlight
- Image and file upload options to provide context
- Broader, more intuitive feature categories that mirrored how they thought about trail elements
Final Designs
In addition to the agency's survey, we built additional tools to support the entire trails network.
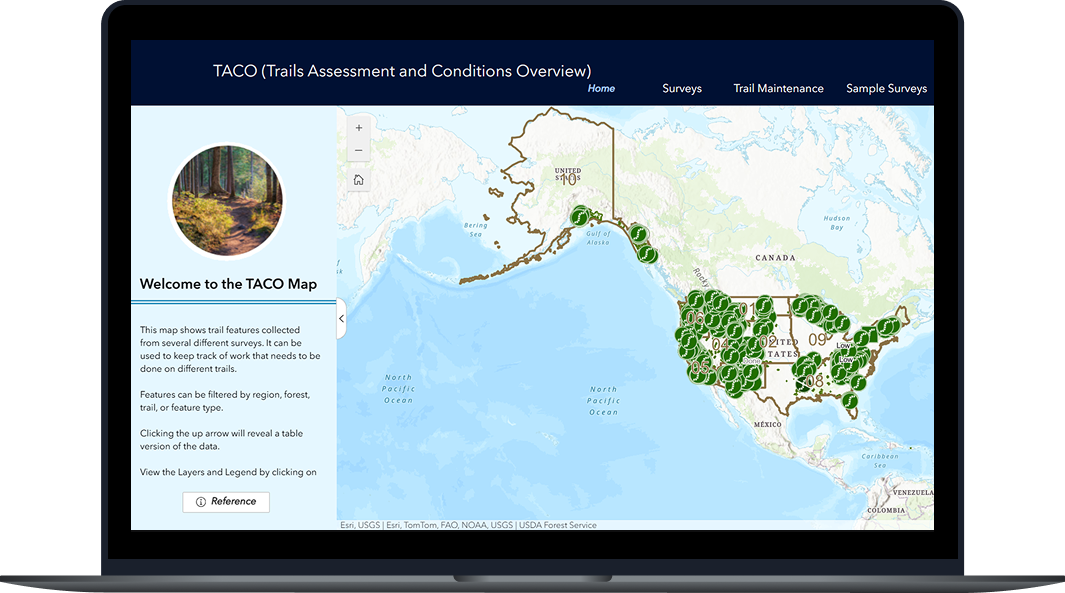
Web Map
Serves as a central platform for visualizing, reviewing, and managing field-collected data.
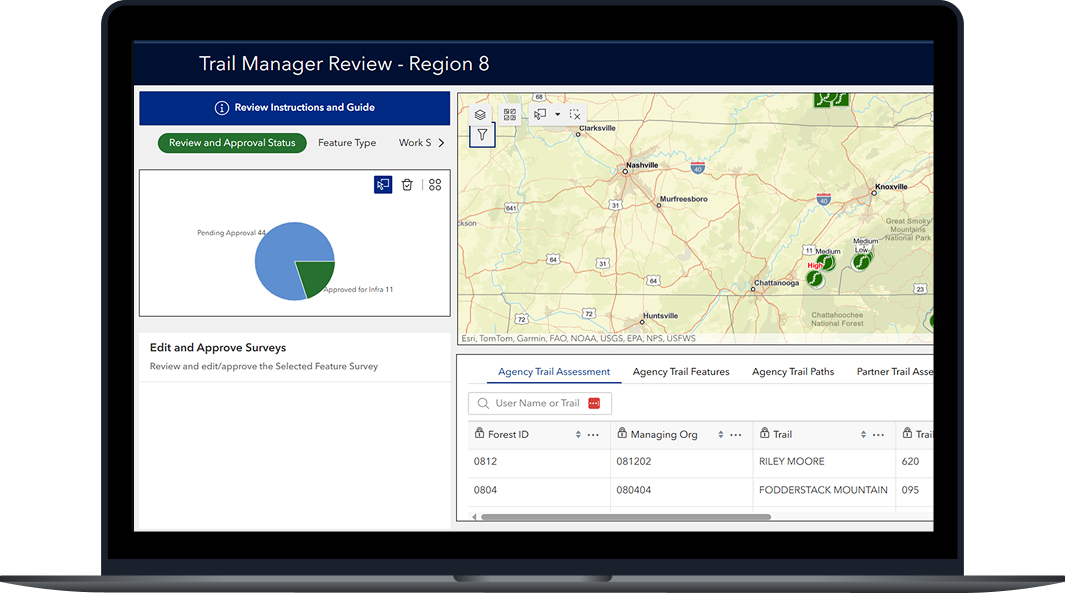
QA/QC dashboard
Managers can now review data quality before it synced with the database, improving data integrity.
Agency, Partner, and Public Surveys
Unified surveys to maintain consistent data collection across all users, including external teams.
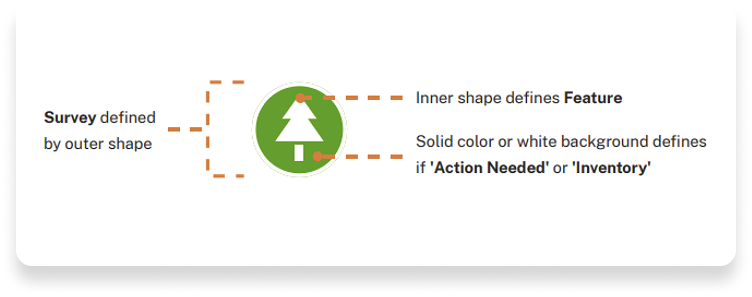
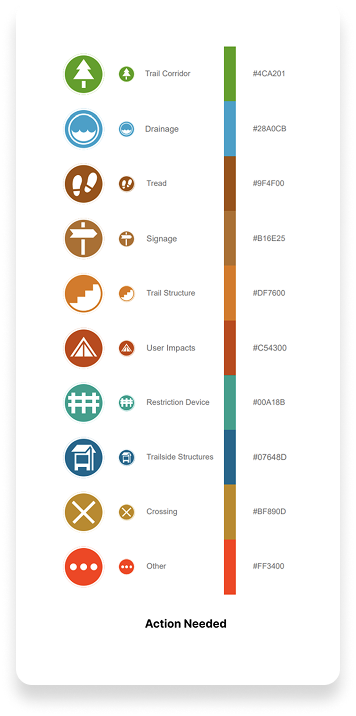
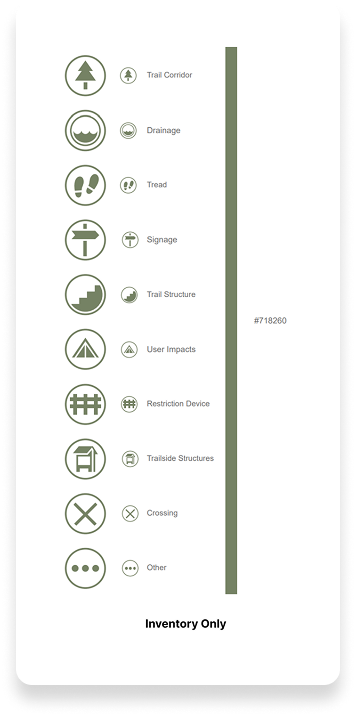
Map Style Guide & Symbology
Using shape, icon, and color we created a layered symbology system in AGOL to make dense datasets easy to scan, filter, and prioritize for 1000+ logged data points.

Flow: Logging an Action Item


OUTCOMES
The MVP was deployed agency-wide in March 2024.
We established continuous feedback loops to ensure our solution evolved with user needs across the trails ecosystem.
LESSONS LEARNED
Align tools with real workflows
Understanding the disconnect between leadership and field crews helped us shift the focus from compliance-driven design to user-centered solutions.
Simplify to Scale
Reducing complexity in the form and automating backend logic helped standardize data while easing the burden on field users.
Build for the Full Ecosystem
Designing tools for managers, field crews, and partners ensured stronger collaboration and more complete data capture.